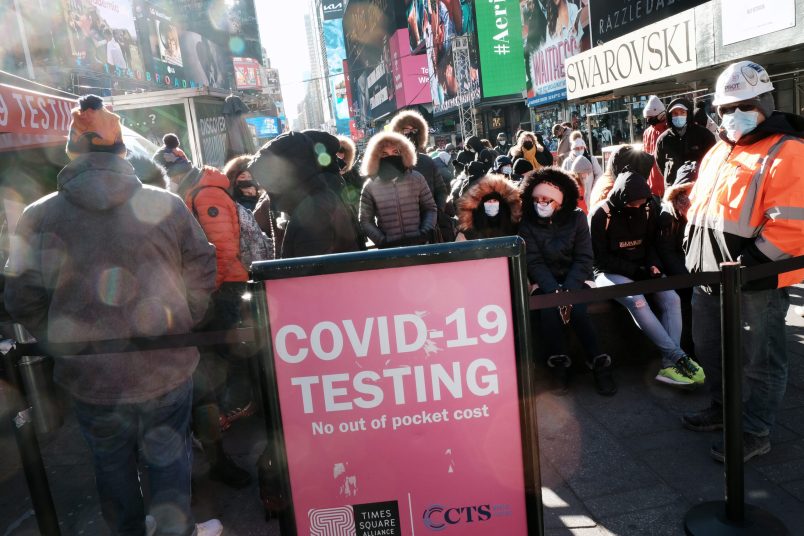
New York City was one of the first parts of the United States hit by the Omicron variant. The trajectory of the city’s surge now appears remarkably similar to the pattern we saw earlier in South Africa and other countries.
Data out of South Africa showed a roughly four week interval between the start of the Omicron surge and its peak. “Peak in four weeks and precipitous decline in another two,” said Fareed Abdullah of the South African Medical Research Council. “It was a flash flood more than a wave.”
New York City numbers appear to match this pattern almost exactly.
It’s difficult to know the precise date at which the Omicron wave begins in New York City. As you can see from this New York Times graph below it seems to be begin the week of December 5th, with an arguable start on December 9th.
There are too many potentially confounding factors to isolate one date specifically, at least from the available public data. The region was already in the midst of a surge of Delta infections, presumably driven by cold weather seasonality. We also don’t have good genomic studies of case percentages, at least not that I could find. The best we can say is that Omicron’s rapid growth seems to begin the week of December 5th and it’s clearly well underway by the week of December 12th. By the end of that week (December 17th) cases had risen nearly 5-fold the number from two weeks earlier.
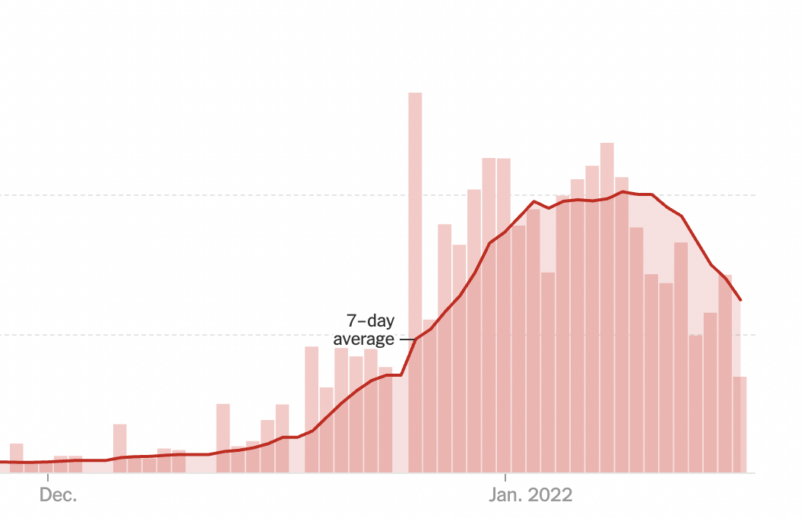
If we choose December 9th as a somewhat arbitrary start date we can then see that the peak comes almost four weeks to the day later on January 8th, when there were 47,591 covid cases. Again, vagaries in test reporting and uncertainty over just when to date the start of the surge make these chronologies at least somewhat fuzzy. But almost any way you measure it, you come out with a duration of roughly four weeks. There’s a similarly rapid decline for the subsequent 10 days, though in absolute numbers, cases remain at least five times higher than at the beginning of Omicron.
Much of the northeast seems to be on something like this trajectory with other parts of the country one or two weeks behind.