Since November 1, to the astonishment and delight of health care advocates, the daily and weekly pace of Obamacare enrollment has been higher than in previous years.
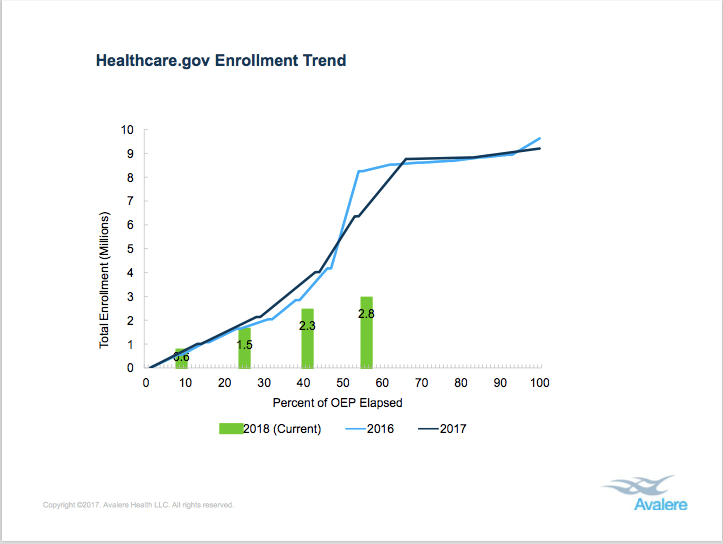
But a new analysis by the health consulting firm Avalere shows that because the Trump administration slashed the length of open enrollment in half—from 90 to 45 days—signups are actually significantly depressed compared to this point in previous years.
Since taking office in January, the Trump administration has severed enrollment partnerships with hundreds of local and national groups, abruptly ended subsidies to insurance companies, scuttled efforts by Congress to pass a market stabilization bill, and eviscerated the budget for open enrollment outreach and in-person assisters. The President has also repeatedly declared Obamacare “finished … dead … gone,” spreading confusion about a law that very much remained on the books.
But the latest report from the Department of Health and Human Services, released on Wednesday, showed signups continuing at a brisk pace, with more than 2.7 million enrollees so far this year.
As Avalere calculated, however, that number is far below the number of enrollees—7 million—who had selected plans last year after this percentage of the enrollment period had elapsed.
Open enrollment ends this year on December 15.


First of all, this is a deeply silly chart. There is zero good reason to plot it this way other than to make “news”.
Second, the majority of Americans who get healthcare through their employer have 45 day or shorter signup periods. My spouse and I both work and we had 2 weeks each (with zero overlap). If we can get it done others can get it done in 45 days. 90 days might have made sense the first year when this was all new but makes little sense now.
The problem with sign-ups (if there turns out to be one) will be lack of outreach and policy FUD driving higher premiums.
So in other words, as long as the rate of enrollment per week continues larger than previous years but less than double, fewer people will end up enrolled? Pretty much what trump’s people planned. And then they’ll be able to claim reduced public support.
The chart doesn’t really tell you much. At this point (50-60% enrollment period elapsed), previous years showed a plateau. It could be the same plateau this year, but we really do not know- we need a few more data points for 2018. However, the rate of enrollment is declining, so it may be unlikely that 7 M will enroll total. Also, we just went through a National Holiday when enrollments are likely to be slack.
Not house on fire stuff until we see more data.
Proof you can make statistics, charts, graphs, etc. say whatever you want, how about the pure numbers and we can figure it outselves.
Generally, people pile in at the last moment, whether they are given 45 days or a 100 days. When we were in college, my wife was the only one who got her term papers done two weeks before the end of the term, and slept like a baby on the night before finals.