The Latest


An Illuminating Graph 
08.07.20 | 4:06 pm
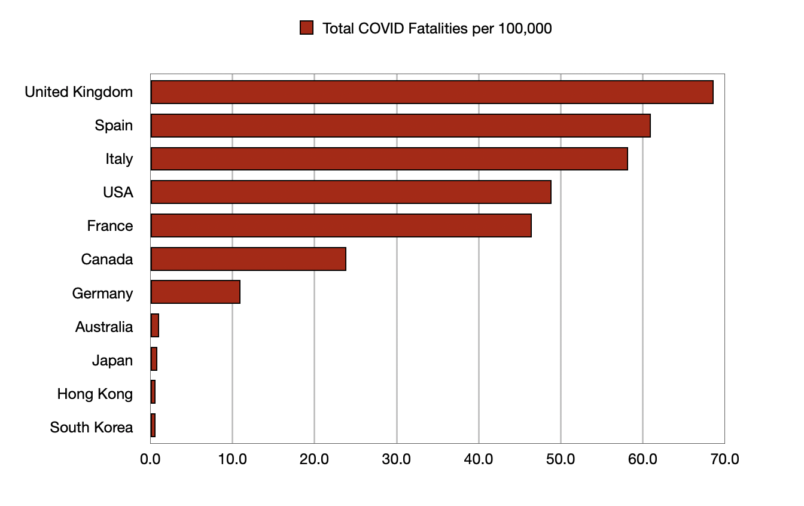
Here is an example of where visualizing data can be very illuminating even if you’ve been steeped in the data in numerical terms. As I mentioned earlier, here is a graph of per capita COVID fatalities to date in the US and the other peer nation states around the globe.