
Over the last week to ten days a wealth of new information has come to light about ‘excess mortality’ in the COVID19 Crisis. My last major installment in this series was back on April 15th when I pulled together preliminary data from a number of countries in Europe and compared them to the emerging data from New York City. As we discussed back in March, the basic formula is the same everywhere: collect data on average mortality in recent years, compare it to the total number of deaths over the same calendar dates this year and then subtract the official COVID19 death toll numbers from that “excess” amount. You are left with an approximate number which captures the true mortality levels, the true number of people who died, because of the COVID19 Crisis and the difference between the ‘true’ number and the official numbers we’ve grappled with in recent weeks.
One issue which arises is that the US is consistently slower to assemble this data than countries in Europe. Much of that is due to federalism and localism. Local governments do the reporting and data collection. Many do not do it quickly. It’s even slower when the same data collectors are coping with the challenges of an unfolding epidemic or working from home because of it. Federal authorities eventually process the data but that can take years before it is released in usable forms.
One thing we found when we looked at those preliminary numbers was a very rough pattern showing up in the US and Europe: Once you ascertain the total excess mortality for a given time and place the official COVID19 death tolls often only account for only roughly half the total. To look at it a different way, the true death toll (either caused by COVID19 disease or the broader crisis) was about double the number of those who died from COVID19 after a lab confirmed test. The percentage isn’t consistent. But across so many countries, reporting systems, different levels of hospital capacity and health care systems, the consistency of this rough pattern is nonetheless striking.
Rather than put together a narrative post I’m simply going to point you toward a number of different articles which bring together different bundles of numbers.
This updated article in the Times looks at excess mortality in dozen countries, mainly but not only in Europe.
Here is an article in The Financial Times from April 21st which pointed to an excess mortality of some 41,000 people of which only 17,337 were captured in official COVID19 death toll tallies.
This Times article looks more closely at the numbers in New York City. The number of unaccounted for Crisis deaths is lower because New York City has already begun adding diagnosed but not lab confirmed COVID19 fatalities its official death toll. As we’ve discussed, in many cases a clinicians or other medical professional probably knew a person had died of COVID19 but they couldn’t be added to official tallies if they didn’t have a positive lab test. Earlier this month, the CDC asked clinicians and medical examiners to include COVID19 on death certificates if the weight of evidence pointed to COVID19.
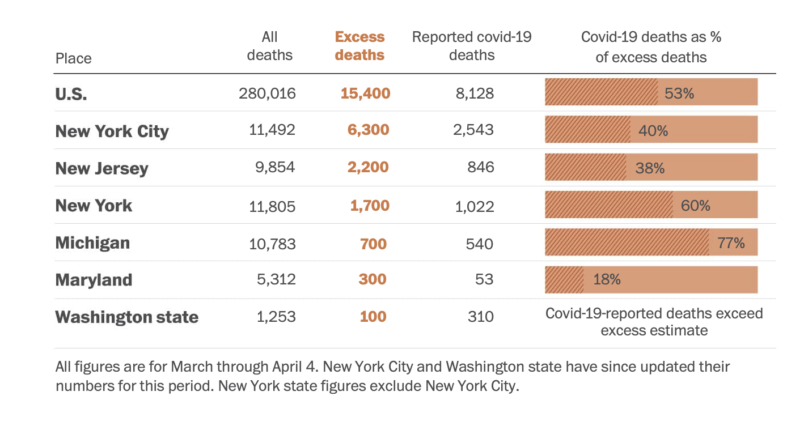
The article in the Post is a study conducted for the Post by researchers at the Yale School of Public Health. They look at different states across the US. It’s certainly no absolute. But we can see the pattern we discussed earlier in April which is that excess mortality deaths often double the number of lives lost as a result of the COVID19 Crisis if not COVID19 itself. This remains a basic question – how many of these additional deaths are caused by undetected or cryptic COVID19 infections vs dislocations and lack of medical care driven by the Crisis itself.
Here’s one instructive chart from the Post analysis.
Here’s an article from the San Jose Mercury News which looks at numbers from Santa Clara County in March. The total numbers are much smaller than most other areas. There were only 32 official COVID19 fatalities recorded. But totality mortality numbers suggest those 32 only account for half the excess mortality.
Finally, The Economist magazine has committed resources to creating this excess mortality hub which brings together a great deal of data from around the world.


