The Rolling Stones are celebrating their 50th anniversary as a band this year, and among the numerous tributes and festivities planned, one is geekier than most: An interactive online tour map, showing all the major stops the Rolling Stones made on their tours over the course of the past half-century:
The tour map timeline (screenshot below) was created by CartoDB, a data visualization company headquartered in New York that seeks to be the “Instagram service for maps.” That is, CartoDB wants to make it easy for individuals, companies and organizations to create and publish maps of whatever data they have, allowing customers to re-organize data in ways that make sense and produce new perspectives.

“CartoDB is an online service to help you visualize data on maps,” CartoDB’s CEO Javier de la Torre told TPM via email. “Maps are probably the most popular data visualization technique. There are many types of maps that can be done and CartoDB is specially good for doing maps of data — not maps for how to get somehwere like Google Maps, but maps to help you understand data. Think for example election maps, maps about climate change, etc.”
CartoDB’s chief product is a cloud-based data visualization program of the same name, which has been used by the likes of NASA and The Wall Street Journal, among others. On Thursday, CartoDB version 2.0 was released, which includes a host of updates, including support for social networks, to allow data mappers to share their creations more easily on Facebook and Twitter, and the ability for users to add custom icons and search boxes.
Here’s a screenshot of The Wall Street Journal’s election map using CartoDB:

And consistent with CartoDB’s aspirations “to become an Instagram service for maps,” as de la Torre put it to TPM, all of the maps created using its software support viewing through mobile devices — smartphones and tablets. De la Torre pointed to one app called SceneNearMe, which shows users famous film and TV locations throughout NYC, as an example of the type of mobile-first app that can be created with CartoDB.
But perhaps more importantly, CartoDB sees 2.0 as a powerful vehicle for expanding its user base to both large and small clients.
“We see CartoDB 2.0 as a milestone for us,” de la Torre explained. “On it we introduced functionalities to handle really large clients. We have now the infrastructure to handle million of map views wth data changing very often. This is opening lot of new possibilities. The simplification of all interfaces that we are doing means that soon people with no expertise at all will be able to make some really complicated maps. So we basically see more potential user base.”
That said, de la Torre does believe that more experienced software developers will have an easier time getting started with CartoDB than the more casual Web user.
“For the most basic type of maps, little experience is needed,” de la Torre explained. “And we are trying to simplify more and more so that users dont need to bring more skills to use CartoDB. But for the time being in order to extract all the power of CartoDB, it can be very useful to know a bit about SQL, the language to query relational databases, and CSS, the language to style websites that we use to style maps.”
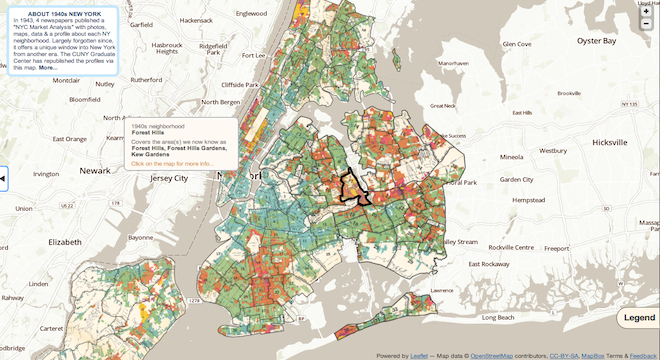
The CartoDB software can layer data atop maps from the likes of Google Maps and OpenStreetMap, too. Take this example of a market analysis of 1940s New York City neighborhoods published by the City University of New York (CUNY) on top of OpenStreetMap and MapBox:

Carto DB is actually a spin-off of another company based in New York and Madrid, Spain, called Vizzuality. Launched 5 years ago, Vizzuality specializes in creating custom data visualization tools and maps for “stories that matter,” as de la Torre put it — mainly “environmental issues like climate change or deforestation, or human rights.”
“Our goal is to help scientists tell important stories with data, stories that can have a positive effect on the world,” de la Torre said of Vizzuality. “To do so we had to develop lot of technology, as visualizing millions of biodiversity records on maps is not an easy task. So we built software for ourselves, and then we thought it would be great if other people could use it, that’s when CartoDB was born.”
Users can sign up to use the basic CartoDB plan for free, which includes up to 5 megabytes of cloud data storage, but the company makes a profit from its other, higher-capacity storage and higher cost plans, ranging from $29 to $149 per month (and all of them named after famed explorers and scientists).
“Configuring and mantaining your own CartoDB can be very expensive,” noted de la Toree. “We take care of that, plus backups and using distribution methods to ensure your maps are always very fast….some of our clients can have up to 2 million map views a day.”
CartoDB also makes much of its own projects open source on the coding repository GitHub.
So while CartoDB may be far from the nearly household name that Instagram has become in its short two-years of existence, it’s still pointing in the right direction to emulate that kind of success.


