As of Feb. 1, nearly 3.3 million Americans have enrolled in private health coverage through Obamacare, the Obama administration reported Wednesday.
January was the first individual month that the law beat its pre-launch projections, a major turnaround from HealthCare.gov’s dark opening months. The initial estimate of 7 million enrollees by March 31 seems at least plausibly within reach.
Another 3.2 million people have enrolled in Medicaid through HealthCare.gov and its state counterparts since October.
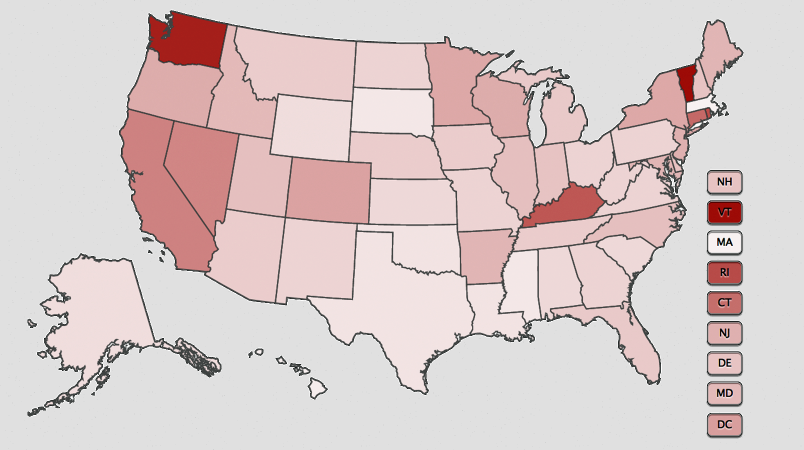
But not every state is having the same experience under the law. The usual suspects (California, New York, Florida, Texas) are leading by sheer enrollment numbers, but the better metric might be how each state is doing in reaching its residents who are potentially eligible for coverage under the law.
TPM’s map above is an attempt to gauge a state’s progress by that metric. Unsurprisingly, the most successful states all established their own insurance websites and expanded Medicaid under Obamacare. All but one of the least successful states defaulted to the federal website, HealthCare.gov, and didn’t expand Medicaid.
Judging by the percentage of enrollees who have signed up after four months, here are Obamacare’s best and worst states. A full methodology is below.
BEST:
1. Vermont: 52.4 percent total enrolled of eligible population (44 percent of private eligibles; 67 percent of Medicaid eligibles)
2. Washington: 47.3 percent total enrolled (18 percent private; 81 percent Medicaid)
3. Rhode Island: 37 percent total enrolled (22 percent private; 54 percent Medicaid)
4. Kentucky: 33.5 percent total enrolled (16 percent private; 46 percent Medicaid)
5. Connecticut: 29.6 percent totaled enrolled (23 percent private; 42 percent Medicaid)
WORST:
1. Hawaii: 3.2 percent (6 percent private; 0 percent Medicaid)
2. Mississippi: 4.1 percent (6 percent private; 2 percent Medicaid)
3. South Dakota: 4.5 percent (4 percent private; 5 percent Medicaid)
4. Oklahoma: 4.5 percent (6 percent private; 3 percent Medicaid)
5. Louisiana: 4.7 percent (7 percent private; 2 percent Medicaid)
*Massachusetts (2.1 percent total) was excluded because of its 2006 health care reform law, which had already significantly expanded health coverage there.
_____
METHODOLOGY
Here’s how we did it.
Private Insurance Enrollees: The enrollment numbers were pulled from the U.S. Department of Health and Human Services’s October and November reports. The estimates for potential eligibles come from a Kaiser Family Foundation report on the potential size of each state’s market for Obamacare coverage.
Medicaid Enrollees: The enrollment numbers were pulled from the U.S. Department of Health and Human Services’s October and November reports. The estimates for potential eligibles combine estimates from an Urban Institute report on adult Medicaid expansion and those already eligible for Medicaid but who are not enrolled and on another Urban Institute report on those already eligible for the Children’s Health Insurance Program but who are not enrolled.
_____
One important note: The potential eligible estimates were not produced by an official government source. By combining independent estimates on the various populations that could enroll in coverage through the law’s marketplaces — the private market and the Medicaid/CHIP population — we have attempted to create a meaningful picture of how each state is doing in getting its residents covered.
Another note: A “0” has been entered if HHS reported “N/A” in that enrollment category.


