The strongest solar storm since 2003 is underway, according to space weather experts at NASA and the National Oceanic and Atmospheric Administration (NOAA).
The event kicked-off with a massive solar flare that erupted on late Sunday, but the brunt of the flare’s particles only began to hit the Earth on Tuesday morning Eastern time, according to NASA.
Solar flares are thought to be caused by shifts in the magnetic fields at sunspots — darker, cooler areas of the Sun that wax and wane on an 11-year solar cycle. Flares often occur in tandem with coronal mass ejections (CME) — rapid releases of massive amounts of charged, radioactive particles, gas and other matter from the Sun. The CME that was expected to hit Earth early Tuesday was anticipated to be traveling at almost 1,400 miles per second, NASA reported.

Astronauts in orbit around Earth and the rest of us back on the ground are safe from the direct effects, but the resulting charged mass of particles striking Earth is causing people to take precautionary measures. It’s also producing striking images.
Most major airlines have re-routed North Pole flyovers to lower latitudes in order to avoid communication disruptions and excess electromagnetic radiation, MSNBC reported. Power stations across the United States were also on high alert for the potential impact of solar winds on their equipment, although they expected the effects this time around to be relatively moderate, the Christian Science Monitor reported.
Meanwhile, skywatchers in Ireland, Scotland, parts of Northern England and Norway have already been treated by spectacular displays of the Northern Lights (the aurora borealis).
And other locales that rarely see the shower of particles hitting Earth’s atmosphere could be in store for a treat as well. The Northern Lights could be visible in parts of New England, upstate New York, northern Michigan, Montana and the Pacific Northwest, according to the Long Island Press. Keep up to date with the forecast on NOAA’s Auroral Activity website.
The real light show, of course, is going on in space.
The Sun is approaching “solar maximum,” a period of peak solar activity that occurs every 11 years or so in what’s known as the solar cycle. The next solar maximum is expected between 2013 and 2014, so there will only be more and fiercer solar storms in the coming months.
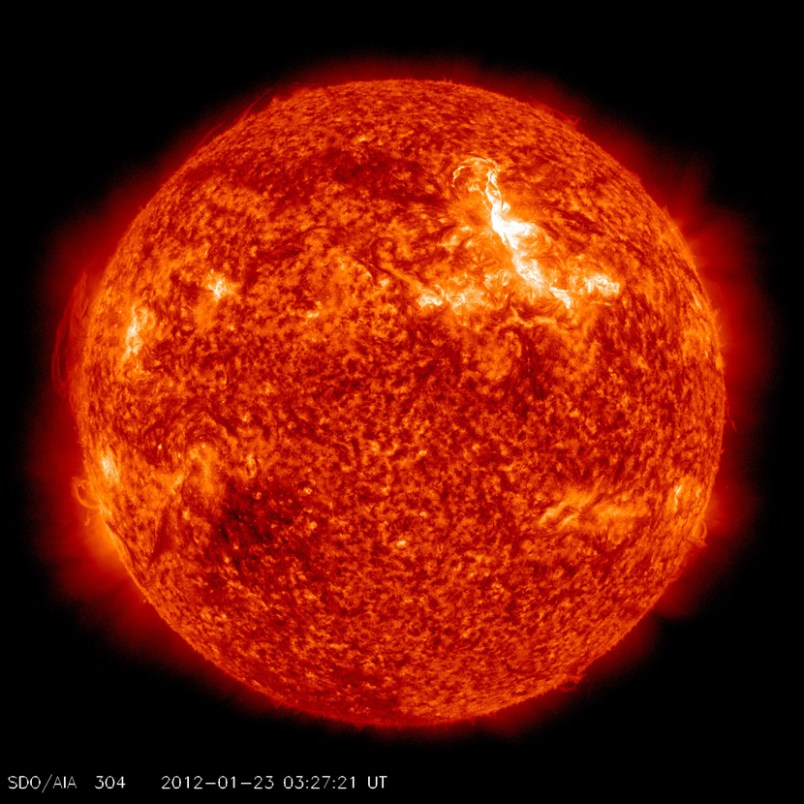
Fortunately, NASA has an instrument dedicated to keeping track of this activity — the unmanned Solar Dynamics Observatory, a spacecraft launched in 2010 with instruments designed to snap images of the various different wavelengths of electromagnetic radiation coming off the Sun at any given time.
“The electromagnetic spectrum isn’t all visible light,” said Karen Fox, a communications officer with NASA’s Heliophysics Division. “But what SDO does is it creates an image based on the available wavelengths of light coming in.”
Fox explained that the glorious images of the Sun’s increased activity available on the SDO website each represent a different wavelength of radiation and a corresponding different temperature. Check out the slideshow of TPM’s favorites here.
“Each one is chosen because it can provide insight about material at a particular temperature on the Sun,” Fox said of the image filters. “We can see a smaller version of a solar event, like a flare, at one temperature and a huge version of the event at another temperature.”
Scientists then layer specific images atop one another in composites to get a better sense of how the Sun’s various layers are working together — or not — to produce specific activities, such as solar flares.
While scientists are still piecing together exact relationship between the various activities on the sun, it’s clear that the number of sunspots waxes and wanes on the solar cycle. Sunspots are darker, Earth-sized areas on the sun that occur when intersecting magnetic fields break through the surface, cooling it.

Thanks to meticulous astronomers, we have excellent data on the total number of observed sunspots over the past several centuries. Check out the above chart for the number of sunspots seen over the past decade to get a sense of just how many we can expect to see in the coming years as the Sun approaches solar maximum.
chart by Clayton Ashley


