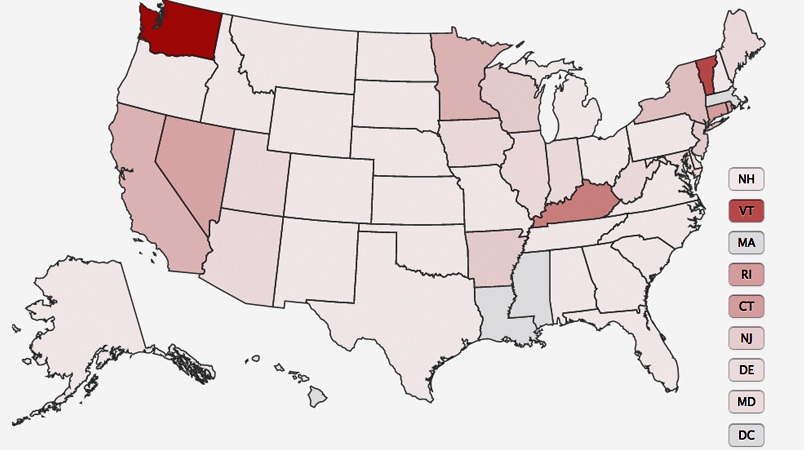
With Wednesday’s release of Obamacare enrollment data, we now have a growing sense of how the law is performing in its goal of getting the uninsured covered by health insurance.
So in the map above, TPM has attempted to paint an interactive picture of how each state is doing thus far with total enrollment, as well as specifically in private coverage and Medicaid.
So what do we know? A few things.
One, there is wide disparity across states — and a lot of that can be traced to HealthCare.gov’s problems. California (107,087) has enrolled almost as many people in private coverage as the 36 states served by the federal site combined. Kentucky (13,145), which built its own site, has enrolled almost as many people as Texas (14,038), which relied on the feds.
Two, enrollment is accelerating. The total for private coverage jumped from 106,000 in October to 365,000 in November. That was true for both HealthCare.gov (from 27,000 to 137,000) and the 15 state-based marketplaces (from 79,000 to 227,000).
Three, enrollment in Medicaid (803,000) is outpacing enrollment in private coverage (365,000). Why is that? One popular guess is that getting enrolled in Medicaid doesn’t require any extra work, while enrolling in private insurance requires an individual to shop for coverage, make a decision and, in many cases, spend money. The difference between the number of people who have completed an application to purchase a private plan (1.2 million) and those who have actually enrolled in a plan (365,000) suggests that might be true.
What we don’t know is the demographic breakdown of these enrollees. Some experts argue that’s as important as the raw number of enrollees — though the law’s goal, of course, was covering the uninsured — because insurers need a certain number of young and healthy enrollees for the finances to work. The goal was that about 40 percent of enrollees would be under age 35.
METHODOLOGY
Here’s how we did it.
Private Insurance Enrollees: The enrollment numbers were pulled from the U.S. Department of Health and Human Services’s October and November reports. The estimates for potential eligibles come from a Kaiser Family Foundation report on the potential size of each state’s market for Obamacare coverage.
Medicaid Enrollees: The enrollment numbers were pulled from the U.S. Department of Health and Human Services’s October and November reports. The estimates for potential eligibles combine estimates from an Urban Institute report on adult Medicaid expansion and those already eligible for Medicaid but who are not enrolled and on another Urban Institute report on those already eligible for the Children’s Health Insurance Program but who are not enrolled.
_____
One important note: The potential eligible estimates were not produced by an official government source. By combining independent estimates on the various populations that could enroll in coverage through the law’s marketplaces — the private market and the Medicaid/CHIP population — we have attempted to create a meaningful picture of how each state is doing in getting its residents covered.
Another note: A “0” has been entered if HHS reported “N/A” in that enrollment category.


