


It now seems very clear that New York state has the worst COVID-19 outbreak in the country and it’s epicenter is in New York City. Out of self-interest I had hoped this was an artifact of aggressive testing. It is now clear that is not the case. The United States now has 11,723 confirmed COVID-19 cases. More than a third of those — 4,152 — are in New York State. Sixty percent of those cases — 2,469 — are in New York City. If you include cases that are in the city’s suburbs the number pushes up toward 4,000.
Let’s dig into these numbers to get a sense of how this relates to the rest of the country, how much these big numbers are driven by aggressive testing and how much lower tallies in other parts of the United States are driven by the absence of testing.
New York State has done 22,284 test and found 4,152 (19%) cases. Washington State has done 17,105 tests and confirmed 1,187 cases (7%). California has done 9,711 tests and confirmed 924 (10%) cases.
Let’s start by noting these are of course not representative samples. Public health authorities are limiting tests to people who are seriously ill and people who come up in contact tracing. Let’s also note that all these numbers are changing rapidly and they’re being reported using different parameters. We shouldn’t see them as absolutes. But they are enough to draw some conclusions.
It certainly seems like the epidemic is considerably further ahead in New York than these other states, each of which has done a lot of testing. But there are some key points to observe. As you can see, New York’s getting many more positives per test. New York also has fewer fatalities not only per confirmed case but even in absolute terms than either Washington State or California. There are 12 deaths in New York, 66 in Washington State and 18 in California. These numbers will of course not hold. To put it in the most merciless terms, COVID-19 takes a while to kill many of its victims. But these numbers do hint at the possibility that New York State is more effectively targeting its tests and that it’s high numbers may be in part do to this aggressive testing regime.
But what about other big states or others so far getting less attention. Florida has received results for 1,923 tests and confirmed 390 (20%) cases. 1,109 more are pending. Texas has run 2,355 tests and confirmed 143 (6%) cases. These are the 2nd and 4th largest states in the country. They’ve done much less testing that the 1st and 3rd largest.
Or consider New Jersey, much of which is functionally part of the New York City in epidemiological terms. 78% of New Jersey’s tests have come back positive for a total of 742 cases. Meanwhile New Jersey had 9 fatalities to New York State’s 12. It certainly seems like New Jersey’s confirmed numbers would be much higher with more testing.
Today I heard from a clinician in a border state who told me that in his state it appears there’s a hotspot in one of the state’s big cities. But, he told me, that’s really just because his academic/medical institution is running all the tests in that city. Things look clean in the rest of the state because of lack of testing.
These numbers give us only an impressionistic look at the state of the unfolding epidemic. More serious numbers people could draw more inferences from them. I’ve tried to convey only some very basic impressions.
One thing that is worth considering is this: our understanding of the pandemic is being obscured to a significant degree by the artifact of national boundaries. Those have some reality in epidemiological terms. News reports are talking about the epidemic in Italy, in France, in Germany. But the United States is a vast country. It seems probably that there are a number of discrete outbreaks in the US, likely following different trajectories. That was clear early on in Washington State. It seems likely that other ones are progressing under the radar of testing.
One mildly positive development is that testing at scale really does now seem to be underway. Pardon the messiness of this graph, the data for which I’ve drawn from the COVID-19 Tracking Project. But it shows the gist.
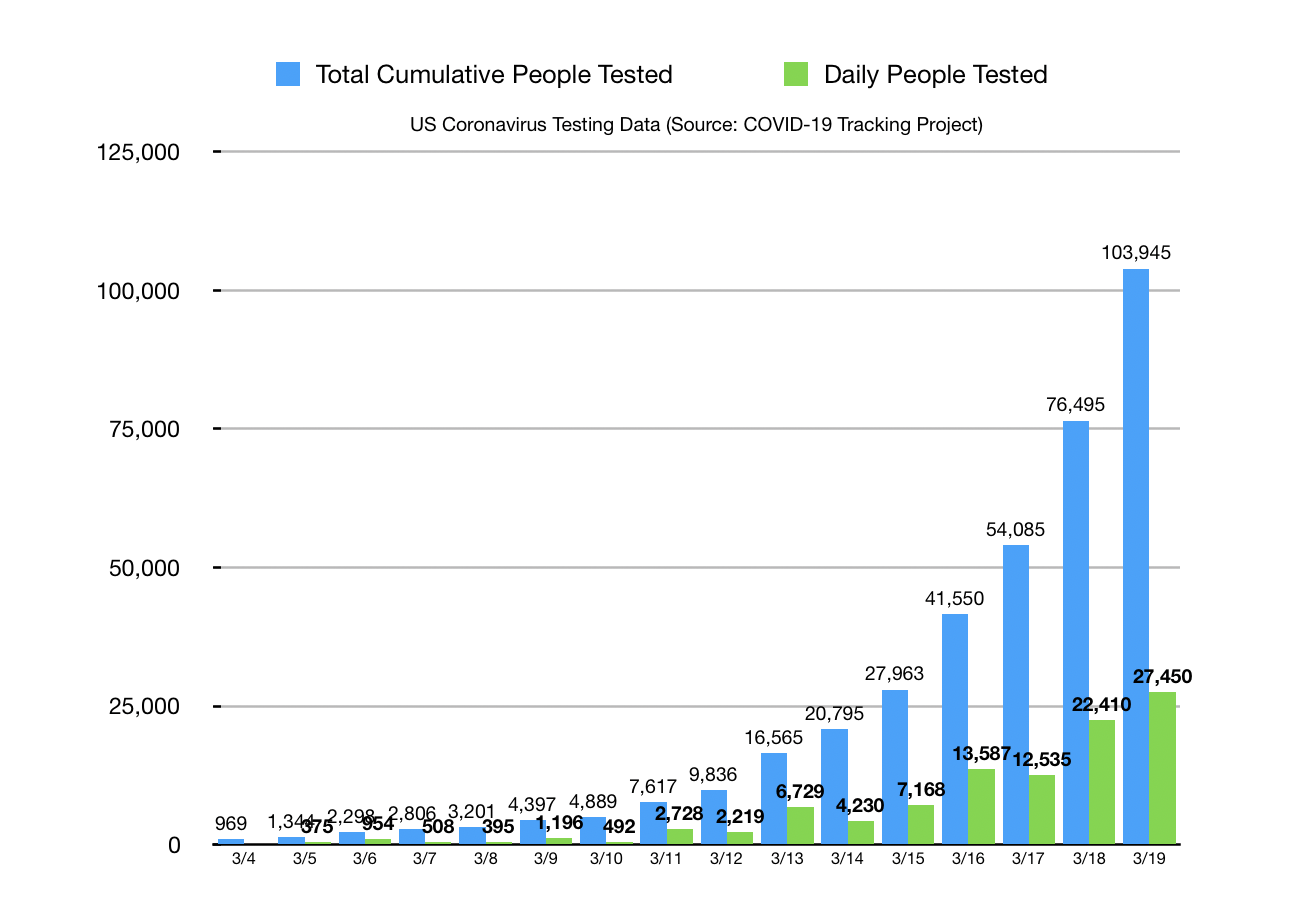
As you can see almost thirty-thousand (27,450) tests were conducted in the last 24 hours, up from 22,410 the day prior and 12,535 the day before that. Still a long way to go and it’s a travesty that we were dead in the water on testing for so long. But things are clearly changing fast on that front. Unfortunately of course they’re running at speed on all the worse fronts as well.