

The U.S. is not the only country that experienced an exceptionally hot 2012: The average global temperature for the year was 58.3 degrees Fahrenheit, making it the ninth-hottest since records began in 1880, according to a new report from NASA released Tuesday.
Meanwhile, a separate annual “State of the Climate” report by the National Oceanic and Atmospheric Administration released on Tuesday as well found that 2012 was the 10th warmest going back to 1880.
The discrepancy was due to the fact that they were compiled separately and found slightly different outcomes based on different data, but both reports agreed that 2012 was in the top 10 warmest in recorded temperature history, and that the warming trend is poised to continue.
“Both reports were independently produced,” NOAA spokesman John Ewald told TPM in brief phone interview. “It’s actually a good thing both reports have slightly different results as it allows for a more accurate overall picture of the climate.”
See a presentation comparing both reports here (PDF).
That picture isn’t a pretty one, either: Nine of the warmest years on record in the top 10 have occurred after 2000, with only 1998 bucking that trend, according to NASA’s calculations. NASA’s new findings for 2012 also displaced 2011 as the ninth-warmest by just a hair (0.08 degrees Fahrenheit).
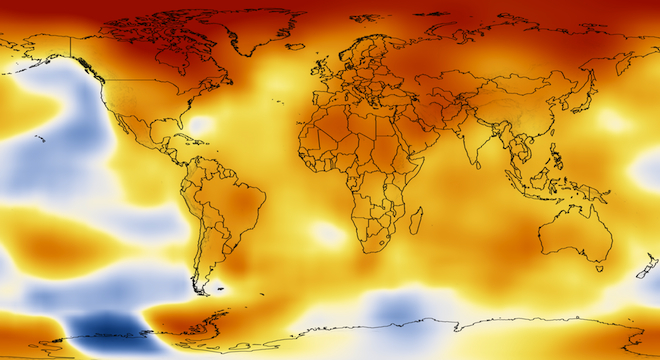
Check out the following video from NASA’s Goddard Institute for Space Studies (GISS) in New York showing average global temperature fluctuations between 1880 and 2011, with yellow and red showing warmer temperatures than the 20th-century baseline:
As NASA’s report additionally found, levels of carbon dioxide, the human-produced pollutant and naturally-occurring greenhouse gas that acts as an effective heat trapper in Earth’s atmosphere, have been increasing markedly since 1880, from 285 parts-per-million to 315 ppm in 1960 to 390 ppm in 2012.
NOAA’s report pointed out that according to its figures, 2012 was the 36th consecutive year that was warmer than the baseline, and that the last colder-than-average year was 1976.
As for what specific effects the warming world and changing climate have had on various regions, NOAA pointed to droughts in the central U.S., northeastern Brazil, Russia, Ukraine and Kazakhstan, as well as wetter than normal conditions in the U.K., Finland and western and central Africa.
Check out NOAA’s map of temperature anomalies in 2012 with respect to the 1980-2010 baseline: